A clear market map helps teams compare categories, spot buying signals, and organize security solutions around business needs, technical depth, and trust, so decisions become faster and smarter.
A market map gives structure to a crowded category. Buyers rarely start with brand names. They start with a problem: identity risk, cloud exposure, endpoint threats, compliance pressure, or a need to replace fragmented tools. Security Software Market Map helps them move from confusion to clarity by grouping solutions into meaningful categories instead of a long undifferentiated list. That is useful for founders, analysts, product teams, investors, and procurement leaders.
Security Software Market Map also makes strategy easier. When a market is complex, teams can misread competitors, overestimate demand in one segment, or miss an adjacent category that is pulling budget away. Security Software Market Map reduces that noise. It shows where categories overlap, where they differ, and which jobs they serve best. When used well, it becomes both a research tool and a decision tool.
What belongs in the map
At its core, Security Software Market Map should answer four questions. What problem does the product solve? Who buys it? What layer of the stack does it operate in? How does it fit next to neighboring categories? If the map cannot answer those questions, it becomes a directory instead of a guide. A useful Security Software Market Map should therefore include category names, short definitions, primary use cases, target buyer profiles, and competitive notes.
It also helps to separate control planes from detection planes. Some tools prevent access, some monitor behavior, some enforce policy, and some support recovery. Security Software Market Map should show those differences because buyers often compare tools that are not truly interchangeable. That distinction can save time, budget, and implementation pain.
A practical format for the map
The simplest format is a two-axis grid. One axis can represent deployment or control depth. The other can represent the primary problem solved. Another good option is to organize by buyer intent: reduce risk, enforce policy, monitor threats, or prove compliance. Security Software Market Map can also be built as a layered stack, starting with identity, then endpoints, cloud, network, application, data, and operations.
| Layer | Example focus | Buyer question | Typical outcome |
|---|---|---|---|
| Identity | Authentication and policy | Who should get access? | Stronger control and fewer account risks |
| Endpoint | Device defense | Is the device safe? | Better threat containment |
| Cloud | Configuration and workload security | Is the cloud posture safe? | Fewer misconfigurations |
| Network | Traffic and segmentation | What is moving where? | Better visibility and control |
| Data | Protection and governance | Where is sensitive data? | Lower exposure and better compliance |
This kind of structure makes Security Software Market Map easier to scan and easier to update as new vendors appear.
Buyer psychology and the hidden logic of choice
Buyers do not evaluate security products only on features. They evaluate risk, confidence, complexity, and internal politics. Security Software Market Map should reflect that reality. Some buyers want faster deployment. Some want stronger reporting. Some want a platform strategy that reduces vendor sprawl. Some want a point solution that fixes one urgent issue without a long rollout. Security Software Market Map can show which categories satisfy which mindset.
That matters because procurement is often emotional even when the language sounds technical. The buyer wants to know whether the tool will work, whether the vendor will support it, and whether the purchase will be defensible later. Security Software Market Map helps frame those trade-offs clearly.
Major category groupings

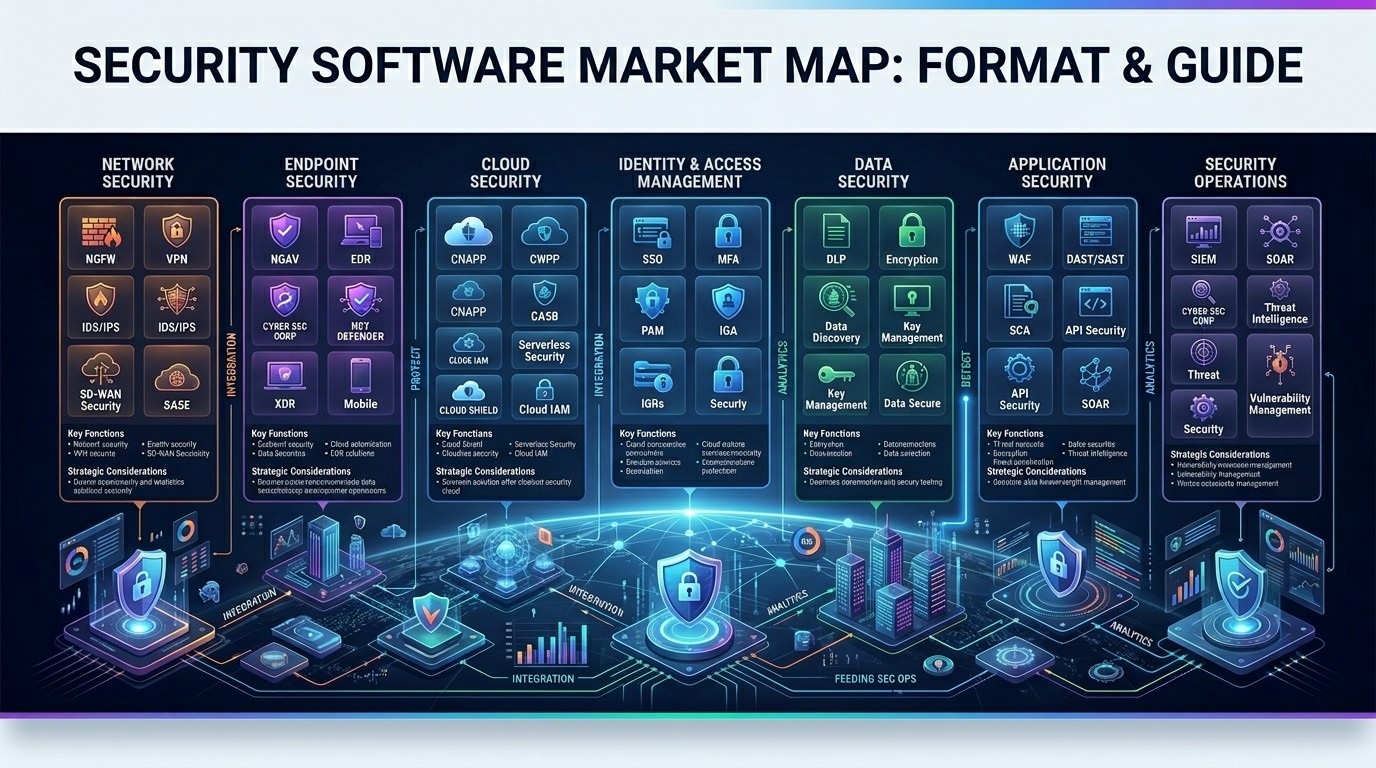
A clear Security Software Market Map usually starts with identity, endpoint, cloud, network, data, and security operations. Identity is about who can access what. Endpoint is about device-level protection. Cloud is about workloads, configurations, and access policies. Network is about traffic control and segmentation. Data is about sensitivity, classification, and protection. Security operations is about detection, response, and investigation.
Each group has subcategories. Identity may include single sign-on, privileged access, authentication, and lifecycle control. Cloud may include posture, workload protection, and access governance. Data may include discovery, masking, loss prevention, and encryption management. Security Software Market Map should not flatten these into one generic security bucket. The better the distinction, the more useful the map.
How to define boundaries without confusion
Market maps fail when categories overlap too much or are defined too loosely. Security Software Market Map needs sharp boundaries. If a product handles identity and cloud and endpoint and compliance, it may belong in a platform layer, but it still needs a primary category. That primary category should reflect what the buyer would most likely search for or compare first. Security Software Market Map should identify the lead use case, then note adjacent capabilities.
This prevents category drift. Without clear boundaries, every vendor starts sounding the same. With boundaries, the map becomes a real research asset. It helps readers see not only where a solution fits but also where it does not.
Why security categories keep changing
Security categories evolve because the attack surface changes. New workloads, remote work, distributed teams, AI-assisted automation, and compliance pressure all change what buyers value. Security Software Market Map should therefore be treated as a living document, not a static report. What mattered three years ago may not be the primary buying trigger today.
For example, buyers once grouped cloud security around basic visibility. Now they may ask about posture, identity context, runtime behavior, and policy enforcement. That shift affects category placement. Security Software Market Map should capture those transitions so the document remains useful after market conditions move.
Access control as a core pillar
Identity and permission management often sit near the center of any serious Security Software Market Map. That is because access is the gateway to everything else. If the wrong user gets access, the rest of the stack is forced to compensate. If the right user gets blocked, the business slows down. The balance between security and usability is one of the oldest problems in the field.
This is where Access Management Tools become essential. They are not just admin utilities. They shape how employees, partners, contractors, and customers move through systems. Security Software Market Map should place these tools close to the core because access policy affects nearly every other layer in the environment.
Cloud posture and the expansion of responsibility
As organizations move workloads into cloud environments, their security map becomes more complicated. Configuration errors, exposed storage, overprivileged identities, and shadow assets can all create risk. Security Software Market Map should therefore include cloud posture as a major segment rather than a side note. It is one of the clearest examples of how the map adapts to modern architecture.
SaaS Security Posture Management Tools belong in this discussion because SaaS is now part of the enterprise perimeter, even if it does not look like one. These tools help teams understand permissions, posture, and exposure across third-party applications. Security Software Market Map that ignores SaaS misses a large part of how modern businesses actually operate.
Mapping endpoints, devices, and users
Endpoints are still important because users work everywhere. Laptops, phones, tablets, and unmanaged devices all create entry points. Security Software Market Map should show how endpoint tooling fits between identity and incident response. That positioning helps readers understand why endpoint defense is not simply antivirus with a new label.
The modern buying question is no longer only about malware. It is also about visibility, policy enforcement, device trust, and remediation speed. Security Software Market Map should make that evolution obvious. When readers understand the role of the endpoint layer, they can compare vendors more intelligently.
A table that shows buyer intent
| Buyer intent | What the buyer worries about | Best category focus |
|---|---|---|
| Reduce breach risk | Unauthorized access and hidden exposure | Identity, cloud, endpoint |
| Prove compliance | Audit readiness and policy control | Data, cloud, governance |
| Simplify operations | Tool sprawl and overlap | Platforms and consolidation |
| Improve detection | Slow response and weak visibility | SOC and analytics |
| Protect SaaS | Third-party app exposure | SaaS governance and posture |
Security Software Market Map becomes more actionable when it is organized around these intents because buyers rarely purchase categories in the abstract. They buy outcomes.
Why market maps help product teams

Product teams use a Security Software Market Map to see where they are differentiated and where they are not. If a product overlaps with ten competitors on features but only two on workflow, that distinction matters. The map can also reveal which adjacent categories influence the deal. Sometimes the real competitor is not the most obvious vendor but the adjacent platform that already sits in the customer’s environment.
Security Software Market Map also helps teams plan roadmap priorities. Instead of adding random features, they can focus on the category signals that matter most to buyers. This reduces noise and improves product-market fit.
Why investors use the same structure
Investors like clarity. They want to know whether a company is serving a crowded point category, a fast-growing platform category, or an emerging niche with strategic relevance. Security Software Market Map helps them sort these possibilities quickly. It reveals whether a startup is building within a durable segment or just riding temporary demand.
It also shows whitespace. If multiple tools solve the same problem but none own a new operational layer, that may signal opportunity. If a category is already saturated, the map may suggest a tougher path to scale. Security Software Market Map does not replace diligence, but it makes diligence more structured.
Operational realism in the map
A useful Security Software Market Map should not assume every company buys the same way. Mid-market buyers may want simplicity. Enterprises may want integration depth. Regulated industries may want policy evidence. Security teams may want automation. Finance teams may want lower tool overlap. That is why a good map balances product logic with buying reality.
This is also where Industry Edge Computing enters the picture. In manufacturing, healthcare, logistics, and critical infrastructure, security architecture may extend beyond the corporate core. Security Software Market Map that includes operational environments can explain why some security tools matter more when systems move closer to the edge.
Telecom and distributed environments
Telecom networks, carrier-grade systems, and distributed service layers create different security needs than a simple office environment. That is why Telecom Edge Computing is worth including in a broad market view. It shows how security decisions change when latency, reliability, and distributed control are part of the equation. Security Software Market Map should note these differences because they influence product fit and buyer expectations.
When the map includes these operational realities, it becomes more than a software checklist. It becomes a guide to where security value is actually created.
Building the map step by step
Start with the problem space. Then identify the main layers. Then place vendors by primary use case. Then note overlaps and adjacencies. Then add the buyer lens. Finally, test the map against real purchasing scenarios. Security Software Market Map should survive the question, “What would a buyer compare first?” If it does not, the categories may need to be rewritten.
This process works because it keeps the map close to real decision-making. It avoids overly academic labels and instead uses practical language. Security Software Market Map should help a user act, not just admire the structure.
Useful labels and naming conventions
Naming matters. If category names are too vague, buyers do not know where to look. If they are too narrow, the map breaks as the market evolves. Security Software Market Map should use names that are familiar enough to be recognized but precise enough to be meaningful.
Good naming usually follows buyer language. For example, “identity governance” is more concrete than “access effectiveness.” “Cloud posture” is easier to understand than “environmental compliance optimization.” The point is not to sound clever. The point is to help readers orient themselves quickly.
How to keep the map current
Update the map on a schedule. Add vendors, remove inactive players, and revise definitions when buying behavior changes. Security Software Market Map should also be reviewed after major platform shifts, new regulations, or major consolidation events. If it is not updated, it becomes less trustworthy.
Competitive analysis inside the map
Security Software Market Map can also include competitive notes. These may describe whether a vendor is platform-led, point-solution-led, enterprise-first, SMB-friendly, or compliance-heavy. Those notes make the map more useful because buyers often evaluate not only what a tool does, but how it is sold and supported.
This is where differentiation becomes clearer. Two tools may appear similar at first glance, but one may be built for deep enterprise deployment while the other is optimized for speed and ease. The map should capture those differences without drowning the reader in noise.
How to avoid category overload
One of the biggest mistakes is adding too many subcategories too early. That creates clutter. Security Software Market Map should begin with the major segments and then add detail only where it improves understanding. Too much detail makes the map harder to read and less persuasive.
A good rule is simple: only add a new category if it changes how a buyer would evaluate options. If it does not change the decision, it may not need its own box. Security Software Market Map should simplify decision-making, not create more of it.
The role of trust and proof

Security buyers care about evidence. They want validation, references, certifications, and implementation confidence. Security Software Market Map should reflect that by noting not only what a vendor sells but how credible its promise appears. This is especially important in regulated or high-stakes environments where failure is expensive.
Trust is not just a marketing issue. It is part of the category definition. Some products win because they are easy to deploy. Others win because they are deeply proven in a specific vertical. Security Software Market Map should show those trust signals clearly.
How this supports sales and messaging
Sales teams can use the map to understand where a prospect is in the buying journey. Marketing teams can use it to write more specific content. Product teams can use it to avoid feature bloat. Leadership teams can use it to prioritize investments. Security Software Market Map becomes valuable because it creates a shared language.
That shared language is powerful. When everyone in the company is using the same category logic, messaging becomes sharper and decisions become faster. Security Software Market Map can therefore improve internal alignment as much as external communication.
A simple matrix for positioning
| Dimension | High-end example | Practical question |
|---|---|---|
| Breadth | Platform coverage | Does it solve multiple problems? |
| Depth | Specialized capability | Does it go deeper than generic tools? |
| Ease | Fast deployment | Can teams adopt it quickly? |
| Governance | Policy and auditability | Can it support control and proof? |
| Integration | Ecosystem fit | Does it work with other tools? |
This matrix works well inside a Security Software Market Map because it adds a second layer of evaluation without overcomplicating the structure.
Why this matters for strategic planning
Leaders make better decisions when they can see the market as a system. Security Software Market Map shows where pressure is building, where categories are maturing, and where buyers are shifting budgets. That makes it easier to decide whether to build, buy, partner, or reposition.
It also helps teams think beyond one quarter. Security markets do not stand still. Security Software Market Map gives organizations a way to plan around that reality rather than reacting to every change as if it were a surprise.
Conclusion
A good market map is more than a visual aid. It is a decision framework that turns a noisy security landscape into a readable structure. It helps buyers compare categories, helps vendors explain value, and helps leaders see where strategy should go next. When the map is built with clear definitions, real buyer intent, and practical boundaries, it becomes a durable tool rather than a static slide. The best version is simple enough to scan, detailed enough to guide action, and current enough to stay relevant as technology shifts. That is why Security Software Market Map belongs at the center of research, planning, and messaging.
Frequently Asked Questions (FAQ)
1. What is a Security Software Market Map?
It is a structured view of security categories that helps people understand how tools fit together, where they differ, and which problems they solve.
2. Who should use one?
Product teams, marketers, sales teams, investors, analysts, and buyers can all use it to make clearer decisions.
3. How detailed should the map be?
It should be detailed enough to show meaningful differences but simple enough that a reader can understand it quickly.
4. What should I include first?
Start with major categories such as identity, endpoint, cloud, network, data, and operations, then add subcategories where needed.
5. How often should it be updated?
Review it regularly, especially after market shifts, new competitors, acquisitions, or major product changes.
6. Is it only for large enterprises?
No. Smaller teams benefit too because the map helps them avoid buying the wrong tool or comparing the wrong categories.
7. Why do labels matter so much?
Clear labels help readers orient themselves quickly and reduce confusion when comparing similar products.
8. Can it help with messaging?
Yes. It gives teams a shared language, which makes marketing, sales, and product communication more consistent.
9. Does it replace competitive research?
No. It organizes research and makes it easier to see patterns, but deeper analysis is still needed.
10. What is the main benefit?
It reduces complexity so decision-makers can see the market clearly and choose with more confidence.


Leave a Reply